RSS Feed

Heavy users of Wireless Tag must have already noticed that since about a week ago the Web Interface on laptops have been receiving push notifications that are normally only delivered to Android and iOS app.

We do not use those annoying notification popup on task bar. It is simply the yellow bar displayed on the top of the web page. If the tag that generated the push is not visible the window will automatically scroll to it. 


If you leave the web browser window open, more and more yellow bars will be displayed one after another as push notifications come in. After you click on the bar to dismiss a notification, the next notification underneath it will be visible. Tag events / notification from ALL tag managers owned by the user will be queued and displayed here, even if the tag that generated the notification is not under the currently selected tag manager. In that case, a link "View" will be on a corner of the yellow bar, click on the link to switch to the tag manager and focus on the tag, without losing the stack of the unread notifications.

 

Comment

Thanks to our long range low power wireless technology, many of our customers install Wireless Tags inside medical and industrial fridges in hospitals and restaurants, ensuring food quality and safe-guarding valuable merchandise from spoilage. Temperature and humidity data are automatically logged centrally in cloud, satisfying HACCP reporting requirements. 

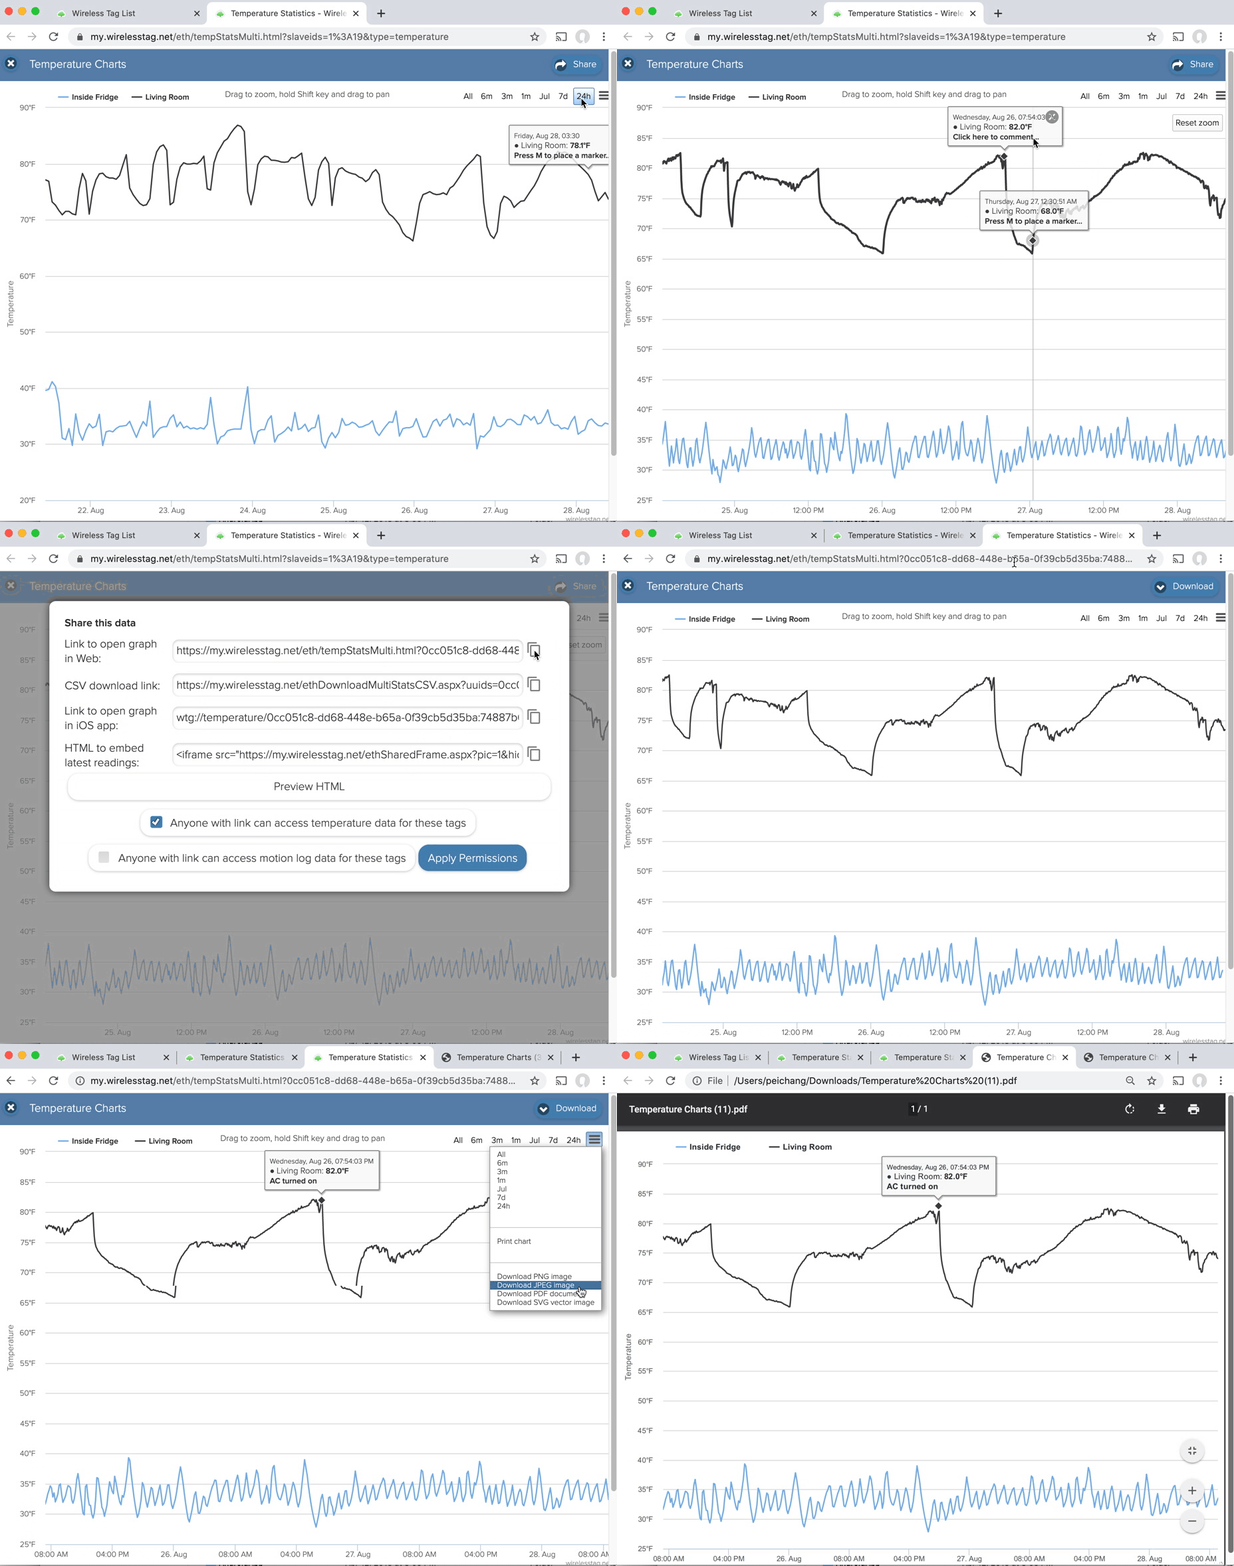
You can pull up the temperature, humidity, ambient light live reports from any web browser anywhere without installing any app. You can also add markers by pressing "M" key. You can click on the marker to assign/edit comments. 

Because the markers and comments are now stored in cloud along with the temperature data, they automatically appear on other computers, when you open the data using the shareable link you generate.  Anyone with the link can export it into a PDF or image, or download the raw data in CSV format to create a report to satisfy your country's regulatory requirements.  But only the logged in user with access to the tag can edit or delete the marker/comments by clicking on comment or the "X" circle. 


Comment

We have some small updates to share today. 

Now in addition to sharing graphs of selected tags, you can share the entire "Recent Trend" screen or only data from selected tags. 

You can share tags/sensors from multiple tag managers on one URL and one screen. And you can control the order each tag appears by arranging the orders of the IDs appearing on the URL. Because this "shared" version of trend screen actually loads a bit faster than the general version, and is very flexible, we suggest also to bookmark it for your own use. 

Another small feature we added today is "range delete":

Before, you were only able to delete all data of the tag, or use the click to remove point feature. Now you are able to bulk delete points from selected date range. This feature will be useful when deleting temperature/RH data from testing periods, so one will only see the data when the tag/sensor is put into actual use. 

These features were added based on request from our customers we received just a couple days ago. Listening to customers like you and adding useful features like these is one of our top priority. If you want something and it makes sense, we will implement it right away! Please request in comment section below. 

Comment
User Interface SDK now available for download: This kit allows you to quickly build and run your own customized user interface in your favorite web browser to access your Tags and Tag Managers, in ways not possible otherwise.

For example, just open the file named "index.html" inside the downloaded zip file, find the auto-update drop-down
  <select data-inline=1 name="updateInterval" id="updateInterval">
    <option value="30">Every 30 seconds (worst battery life)</option>
    <option value="60">Every 1 minute</option>
     ......
  </select>
and add an entry such as
    <option value="86400">Once a day</option>
Save the file, and open Mongoose (use included Windows version or download Mac/Linux version or build your own) to immediately try your own user interface on your account at mytaglist.com to access your Tag managers and tags.

Here is another example: Open "styles/client.js", locate the function
function createTagList() {
  $.ajax({
    url: WSROOT + "ethClient.asmx/GetTagList",
      success: function (retval, textStatus) {
	...
      for (var i = 0; i < retval.d.length; i++) {
         updateTag(retval.d[i]);
      }
        ...
This code calls our JSON API to retrieve information about the tags as Javascript objects.
Add the line
      retval.d.sort(function(a,b){ return b.lastComm-a.lastComm; });
just before the for loop. This simple change will make the most recently updated tag always come at the top of the list. Instead of lastComm, you can sort using other properties like signal strength, status, battery voltages... see http://mytaglist.com/ethClient.asmx?op=GetTagList for available properties in the returned data object.

These are just simple examples. You just need some basic knowledge of JavaScript, HTML and imagination.
When you are done developing your own Web UI, just zip the entire folder and share with others. We are excited to learn what kind of unique user interface you can come up with.
Comment